Author Archives: Dennis Morton

Splunking Wonderware Industrial Data + The Wonderware App

Share

I recently had a customer request to I see what Icould do about getting their Wonderware industrial control data (SCADA) into Splunk. Their motivation was simple: help us focus on what’s important. They were generating tens-of-gigabytes of data per day – much of which was noise – and the built-in Wonderware reporting tools were… sub-optimal. It didn’t take too long and they were extremely pleased with the results!

Ingesting Wonderware Data

Unfortunately, unlike many Industrial Control Systems, Wonderware has no built-in Splunk support (or even a supported plug-in of some sort). While it does write it’s logs to a file, the data is in a proprietary binary format! Fortunately, Andrew Robinson created an open-source C# solution – aaLogReader – for reading those binary files – and he even includes some examples of how to forward the data into Splunk!

**Aside: To make things easier for others I packaged it up into an App on Splunkbase. The App has everything you need to ingest and visualize Wonderware data – including a pre-compiled .NET executable and example inputs.conf file.

Continue reading

Configuring and Optimizing the F5 Analytics App’s KPI Generation System

Share

As mentioned in my previous post, one of the key features of the F5 Networks – Analytics (new) App is it’s KPI generation subsystem. Unfortunately, when I developed it I ran out of time to do much documentation on how to properly set it up. This post will clear up that oversight 😉

KPI System Overview

The purpose of the KPI generation system is to allow many sub-KPIs to be rolled-up into overall KPIs and then be written to a summary index for super-fast searching and reporting. Without it, the KPI searches would be extremely slow – for example, the top-level device KPI search is 183 lines of SPL (after macro expansion)!

The KPI generation system consists of the following parts:

  • A set of ~28 macros named beginning with “t_” that contain the default threshold values. For example, “t_kpi_cpu_violation” defaults to “65”, which means that your CPU health will take a hit if it’s consistently over 65%.
  • A set of ~70 macros that build upon each other to calculate the sub-KPI values, culminating in a set of top-level macros that generate overall device and application health.
  • A python-based modular input to generate the actual KPI data and write it out to a summary index. I could do an entire blog post on how it works and the logic behind making sure it doesn’t destroy your Search Head!

A quick note on the need for the modular input vs regular scheduled searches with Summary Indexing enabled: using regular searches was not possible due to the index-related RBAC built into the App itself. This RBAC capability is crucial in that it allows an admin to – for example – only allow the Sharepoint Admin to see their data and not the data from the IIS application. Using a modular input allowed for dynamically determining which Summary Index to use.

Continue reading

Which F5 App Should I Use with Splunk?

Share

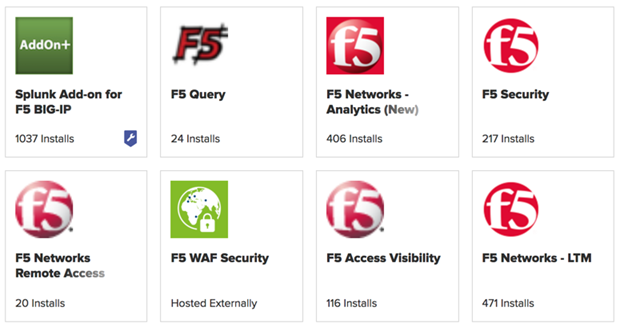
So you have Splunk and F5’s but are thoroughly confused about which F5 App to use because Splunkbase has eight!


It’s actually simpler than it seems, so let’s do a rundown of what each F5 App actually does.

Continue reading

A Brief Introduction to Netcool Impact Event Isolation and Correlation (EIC)

Share

Overview

Event Isolation and Correlation, or EIC, is a solution that is included with IBM Netcool/Impact as of release 6.1, and is intended to provide built-in functionality allowing the association of dissimilar alarms to each other (i.e. to correlate them together) in a “root cause” and “symptom” relationship for the Netcool OMNIbus and Impact products.

Components

The EIC solution is composed of:

  1. Netcool Impact (6.1+)
    1. Data Sources
    2. Operator Views
    3. Impact policies
  2. Netcool OMNIbus
  3. A DB2 database containing the required Service Component Registry (SRC) tables, obtained through the implementation of the TBSM schema.
  4. Optional components
    1. TBSM
    2. TADDM
      Continue reading

Importing Aternity Log Data in to Splunk, Part 1

Share

In this post I will be going over how to import unstructured data in to Splunk, extract fields from the data, and use those fields to create a simple dashboard. This example can be followed using a free trial of Splunk, available here. The sample data I will be using is available here. For this post I’ve used a Windows instance of Splunk, but the interfaces are largely the same, so you should have no trouble following along if you choose to use Linux instead.
Continue reading