
As mentioned in my previous post, one of the key features of the F5 Networks – Analytics (new) App is it’s KPI generation subsystem. Unfortunately, when I developed it I ran out of time to do much documentation on how to properly set it up. This post will clear up that oversight 😉
KPI System Overview
The purpose of the KPI generation system is to allow many sub-KPIs to be rolled-up into overall KPIs and then be written to a summary index for super-fast searching and reporting. Without it, the KPI searches would be extremely slow – for example, the top-level device KPI search is 183 lines of SPL (after macro expansion)!
The KPI generation system consists of the following parts:
- A set of ~28 macros named beginning with “t_” that contain the default threshold values. For example, “t_kpi_cpu_violation” defaults to “65”, which means that your CPU health will take a hit if it’s consistently over 65%.
- A set of ~70 macros that build upon each other to calculate the sub-KPI values, culminating in a set of top-level macros that generate overall device and application health.
- A python-based modular input to generate the actual KPI data and write it out to a summary index. I could do an entire blog post on how it works and the logic behind making sure it doesn’t destroy your Search Head!
A quick note on the need for the modular input vs regular scheduled searches with Summary Indexing enabled: using regular searches was not possible due to the index-related RBAC built into the App itself. This RBAC capability is crucial in that it allows an admin to – for example – only allow the Sharepoint Admin to see their data and not the data from the IIS application. Using a modular input allowed for dynamically determining which Summary Index to use.
Enabling KPI Generation
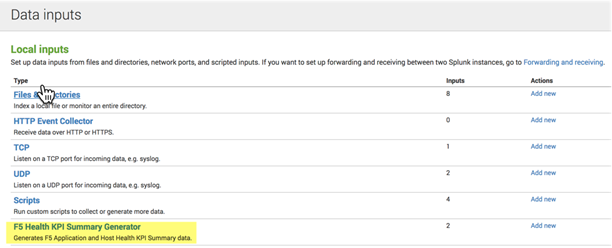
The App installs with both modular inputs disabled. To enable them, navigate to Settings->Inputs and click on the “F5 Health KPI Summary Generator” link:
Clicking on “app_kpi_gen” (“host_kpi_gen” has similar settings) yields the following configuration screen:
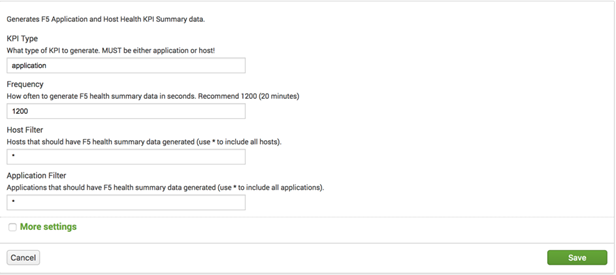
The setting descriptions are straightforward – just be sure to not set the Frequency too low or you will start skipping searches!
Once you are satisfied with the changes, click the “Enable” link here:
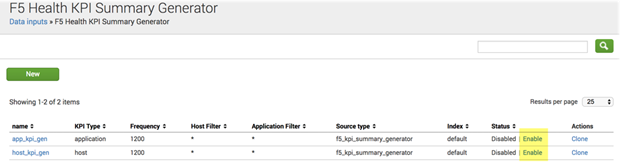
Note that you cannot change the Index setting from the GUI since it’s determined “on-the-fly”.
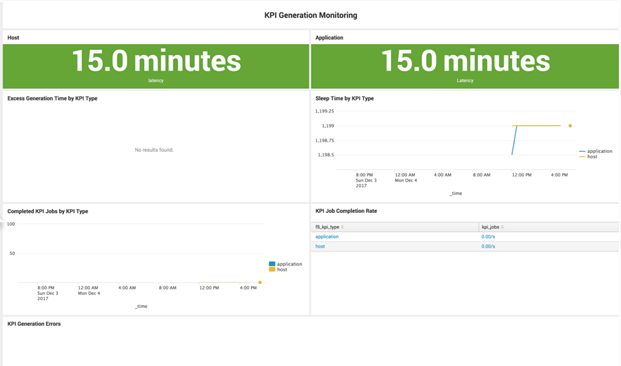
Once the KPIs are running, you can use the Administration->Stats on Stats dashboard to monitor KPI generation:
You will also want to use your Splunk Monitoring Console to monitor the Skip Ratio (see below for some recommended configuration changes).
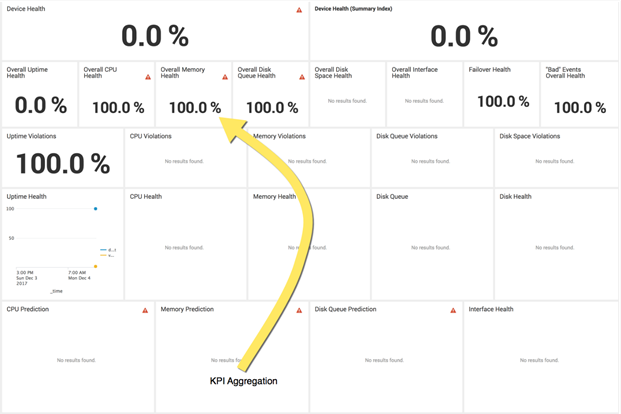
There are also two dashboards under Administration (Device Health and Application Health) that can help you understand how the KPI numbers are being calculated since most of the KPI’s are composed from sub-KPI’s. The screen shot below illustrates this for the Overall Memory Health KPI – it is calculated by combining a predictive/outlier KPI (Memory Prediction), overall memory usage (Memory Health), and a KPI that calculates how often a threshold is violated (Memory Violations).
Important – SHC Support
The KPI Generation system does not support Search Head Clustering! Do not under any circumstances enable the modular inputs on a SHC member since doing so will heavily impact the entire Cluster. The modular input is not SHC-aware (and does not use the Splunk scheduler), so enabling the inputs will cause the KPI generation searches to run on all SHC members (which is not good).
Recommended Splunk Configuration Changes
Since enabling KPI generation adds a fair number of scheduled searches and the App also has 52 (!) Accelerated Data Models, there are two changes you will want to make in limits.conf on the Search Head to avoid having a terrible skip ratio (e.g. > 95%).
[scheduler]
auto_summary_perc = 100
max_searches_perc = 75
These changes tell Splunk that up to 75% of available searches can be scheduled (the default is 50%) and that up to 100% of those scheduled searches can be data model acceleration searches (the default is 50%).
Why do you need these settings? Let’s take the example of a 16 core SH with default settings:
- Max allowed concurrent searches (system wide): 22
- Max concurrent scheduled searches: 11
- Max concurrent datamodel acceleration searches: 5
With only 5 search slots but 52 searches needing to be run every 5 minutes, most datamodel acceleration searches will be skipped and the datamodels will fall behind – especially if there are actual users on the system!
Note that these settings are also the current recommended best practice settings for Enterprise Security – another heavy datamodel-dependent App.