
Overview
Event Isolation and Correlation, or EIC, is a solution that is included with IBM Netcool/Impact as of release 6.1, and is intended to provide built-in functionality allowing the association of dissimilar alarms to each other (i.e. to correlate them together) in a “root cause” and “symptom” relationship for the Netcool OMNIbus and Impact products.
Components
The EIC solution is composed of:
-
Netcool Impact (6.1+)
- Data Sources
- Operator Views
- Impact policies
- Netcool OMNIbus
- A DB2 database containing the required Service Component Registry (SRC) tables, obtained through the implementation of the TBSM schema.
-
Optional components
- TBSM
- TADDM
How EIC Works
The EIC solution, without the optional components, is primarily based around the use of “Event Rules”. These rules allow you to define correlations between alarms, defining which events are root causes and what their corresponding symptom events are and vice versa through the use of SQL filters on the ObjectServer. After the relationships are defined in the Event Rules, they are utilized by the Impact policies composing the EIC solution to determine whether an OMNIbus event is part of a correlation. This process is kicked off when a Serial field from an OMNIbus event is passed to the “EIC Analyze” operator view.
An operator view works like a CGI script with Impact as the backend. The EIC Analyze operator view specifically acts as the front end interface to the EIC solution, containing the logic that ties together multiple Impact policies and its data sources together. Also similar to CGI, operator views are accessed through a web server (through TIP/Websphere in this case) URL. The EIC Analyze operator view is accessed through a URL containing the Serial number of an OMNIbus event. The Serial number is then passed through the Impact policies, checked against the Event Rules defined in the DB2 database, and if an alarm is part of a correlation (defined with the Event Rules) the EIC Analyze operator view page will present you with either the OMNIbus root cause event, or the symptom events associated to the alarm originally passed through the URL.
Event Rules
Defining the relationships between alarms (or correlations) is done through the creation of Event Rules in the EIC rule configuration; below you will find an example of the creation of one of these rules.
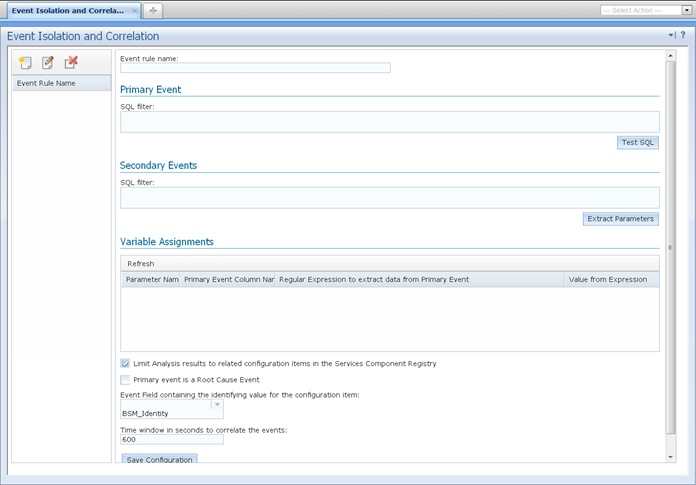
An Event Rules is composed of:
- Event rule name (a label for the rule)
-
Primary Event
- This is a SQL filter that identifies the specific event(s) this rule operates on.
- This can identify either root cause or symptom event(s).
- Think of this filter as defining “what is different?” – what uniquely identifies an alarm as either the root cause from the symptom events, or the symptom event(s) from the root cause.
-
Secondary Events
- This is a SQL filter that identifies alarms related to the Primary Event definition above.
- Depending on the Primary Event SQL filter above, this can identify either root cause or symptom event(s).
- This filter specifies “what is the same” as well as “what is different?” Meaning that you will be defining the fields that relate the Secondary Events to the Primary Event answering the question “what is the same?” as well as specifying the field(s) and value(s) that answers the question “what is different?” uniquely identifying the Secondary Events from the Primary Event.
- To help us describe “what is the same?” The Secondary Events filter will feature variables that will be replaced via Regex with values from the Primary Event. These variables are enclosed in @ signs: Ex. Node = @node@.
-
Variable Assignments
- These are definitions of the variables (ex. @node@) that are used inside the Secondary Events filter above, and are used to relate the Primary Event(s) to the Secondary Event(s).
-
They are composed of
-
Parameter name
- Variable name
- Ex. “node”
-
Primary Event Column Name
- ObjectServer field to extract from
- Ex. Node
-
Regular Expression to extract data from Primary Event
- This is an Impact regular expression.
-
Ex. Node = system1.ossintegrators.com
-
Since we need the whole thing, we make it capture all of the Node via this Regex
- (.*)
-
- Value from Expression This value shows what the regular expression extracts from the primary event SQL filter)
-
- These are what define “what is the same?” Identifying the commonality of specific fields that relate the Primary Event to the Secondary Events
-
Limit Analysis results to related configuration items in the Service Component Registry (checkbox)
- If you don’t want to use the SCR/TADDM/TBSM component, uncheck this box
-
Primary event is a Root Cause Event (checkbox)
- Check this box if the SQL Filter for the Primary Event is the root cause event
- Leave unchecked if the Primary Event filter identifies a symptom event
Example Correlation
Below is an example of how you would create an Event Rule for use with the EIC solution, for the given correlation defined in “the events” section below.
The events
In this example correlation, we’ve determined that “LinkDown” alarms cause “EthernetPortLocalFault” alarms on the same device.
![]()
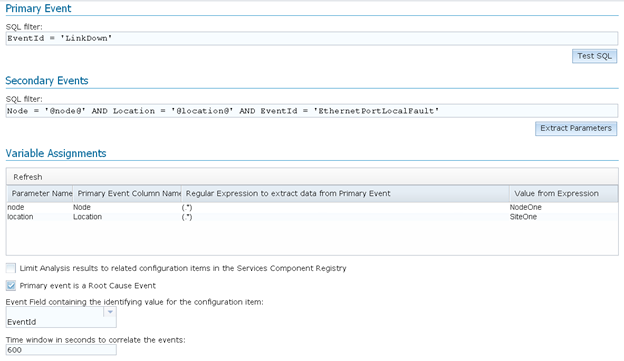
Above we see a Critical event that has an EventId of “LinkDown”. For our example, this will be the root cause event since we know that alarms with an EventId of “LinkDown” cause alarms with an EventId of “EthernetPortLocalFault”. his means “EventId = LinkDown” will be our Primary Event SQL Filter since this SQL filter will single out only the root cause alarms (i.e. this is “what is different” from the symptom events).
Shown below are the “EthernetPortLocalFault” alarms, which we know are caused by a “LinkDown” alarm (defined in the Primary Event SQL filter). In our Secondary Events SQL Filter the EventId will again be a part of it like it was in the Primary Event SQL filter, signifying “what is different” between alarms (in this case LinkDown vs. EthernetPortLocalFault). If we left the Secondary Events SQL Filter with just “EventId=EthernetPortLocalFault” however, this would have the unintended result of potentially grabbing EthernetPortLocalFault alarms from devices that are completely different from the Primary Event. So in addition to the EventId, we will need some other combination of fields that will be the same as the Primary Event, so we can be sure that this particular LinkDown alarm caused these particular EthernetPortLocalFault alarms.
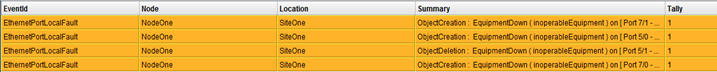
You can see that the alarms share the Node, and Location fields. These fields will become our variables for use in the Secondary Events SQL filter, because these fields are the answer to “what is the same?” between the alarm defined in the Primary Event SQL Filter from the Secondary Events defined in its SQL. The variables are defined in the “Variable Assignments” section, and they define values to be taken directly from the event that matched the Primary Event SQL Filter (that you passed in via the Serial to the EIC Analyze Operator View).
Rule
EIC Analyze
To view the relationships we just defined with the rule above, you will need to send the Serial of an event you want to analyze to the EIC Analyze operator view.
To do this, setup a WebGUI tool that points to the EIC Analyze operator view that came with the EIC solution so that when you right click and select the tool it will send the Serial event field to the operator view.
After the rule and tool have been created, when you select an event that matches the criteria of the Primary Event SQL filter and use the tool, it should show you the EIC Analyze operator view page similar to the screenshot below:
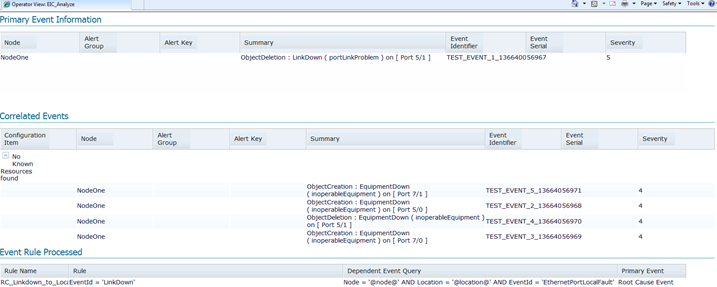
The page above is what the EIC Analyze operator view should look like after finding the rule created in the previous section.
You’re seeing the analysis of the alarm in the page, first which event matched the Primary Event filter, and in the Correlated Events you see the events that matched the Secondary Events filter. To see the correlated events you’ll need to click the dropdown to the left of “No Known Resources found”, which is referring to the TADDM/TBSM portion we left off when we unchecked the “Limit the results to the related configuration items in the Service Component Registry.” At the bottom of the page you’ll see the rule name that was processed when it matched the event you passed into the EIC Analyze operator view.
Why Implement EIC?
Implementing EIC can provide several benefits:
- It can give network operators a quick way to define and view relationships between various alarms. For example, a new operator likely doesn’t know the ins and outs of how alarms relate. However, if they use the EIC Analyze tool they can quickly determine if an alarm is a root cause event or if it’s a symptom event. This would avoid a potential ticketing of a symptom event.
- While this solution only provides a manual way of getting a basic visualization of the defined relationships out of the box, it can be used as a base from which to add customizations to increase its features. For example automating the process of analyzing alarms, the ability to suppress symptom alarms, and anything else supported by Impact Operator Views (which is extensive).
- The EIC Solution uses operator views extensively, so if you are not familiar with their functionality it can give you a good idea of how they can be leveraged to provide new means to access Netcool Impact, OMNIbus, and all their supported integrations.