
I recently had a customer request to I see what Icould do about getting their Wonderware industrial control data (SCADA) into Splunk. Their motivation was simple: help us focus on what’s important. They were generating tens-of-gigabytes of data per day – much of which was noise – and the built-in Wonderware reporting tools were… sub-optimal. It didn’t take too long and they were extremely pleased with the results!
Ingesting Wonderware Data
Unfortunately, unlike many Industrial Control Systems, Wonderware has no built-in Splunk support (or even a supported plug-in of some sort). While it does write it’s logs to a file, the data is in a proprietary binary format! Fortunately, Andrew Robinson created an open-source C# solution – aaLogReader – for reading those binary files – and he even includes some examples of how to forward the data into Splunk!
**Aside: To make things easier for others I packaged it up into an App on Splunkbase. The App has everything you need to ingest and visualize Wonderware data – including a pre-compiled .NET executable and example inputs.conf file.
If you don’t want to use the pre-built executable from my App you’ll need to build it yourself. While outside the scope of this post, it’s a straightforward process that only requires freely available tools. To get it running you’ll need to do the following:
- Download a copy of the Community version of Visual Studio.
- Clone the Git repository and open the solution.
- Fix the reference to log4Net.
- Build the solution.
- Right-Click on the aaLogSplunkConsole Project and choose “Open Folder in File Explorer”.
- Copy the bin/Debug folder to your Arhcestra system or Deployment Server and rename it to something sensible.
There are other options included in the solution – including a Modular Input – but I chose the lowest friction option of a Scripted Input.
Ingestion Options
The only change you might need to make is to point aaLogReader to the correct log path. This is done via an options.json file (included in the App) that looks like this:
{
“LogDirectory”: “C:\\ProgramData\\ArchestrA\\LogFiles”,
“CacheFileBaseName”: “aaLogReaderCache”,
“CacheFileNameCustom”: “”,
“CacheFileAppendProcessNameToBaseFileName”: true,
“IgnoreCacheFileOnFirstRead”: false
}
Once you have the correct options.json you’ll need to distribute the App to all Wonderware servers – ideally via a Deployment Server – along with an inputs.conf file (example included in the App).
Analyzing Wonderware Data
Once I had the data ingesting correctly, it was time to see what I could make Splunk do with it. I ended up writing three dashboards: two to analyze the data and one to show the health of the data collection system.
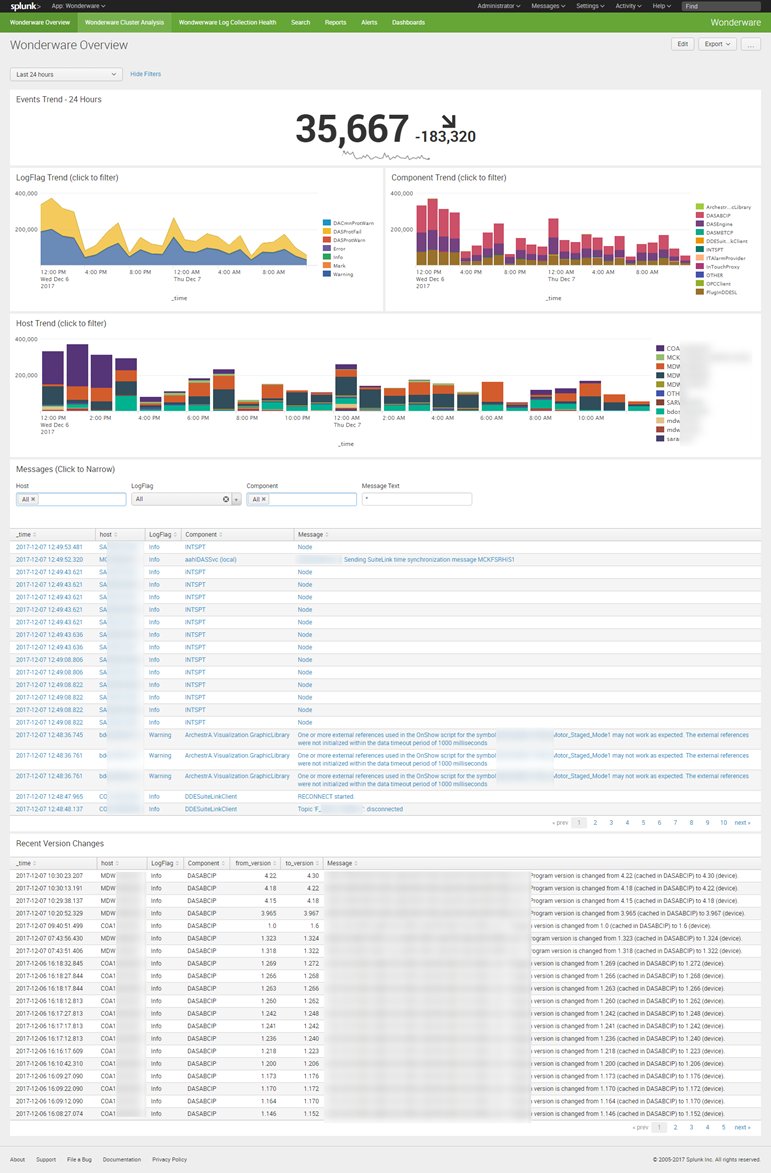
The goal of the Overview dashboard below was to make it simple to find interesting data trends (e.g. event volume, LogFlags, Components, and Hosts) and provide a simple interface to encourage data exploration. The customer also had a specific need for identifying PLC version changes (last panel).
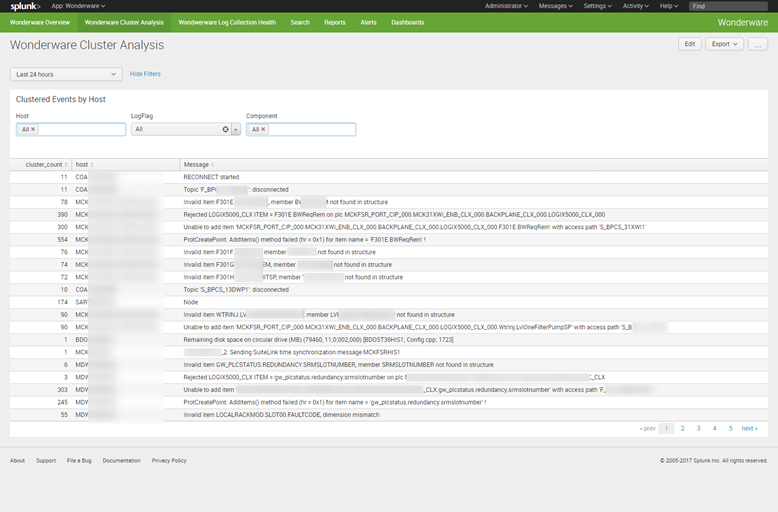
The purpose of the Cluster Analysis dashboard was to leverage the cluster command to “surface” rare events – a very useful function given how truly chatty Wonderware is!
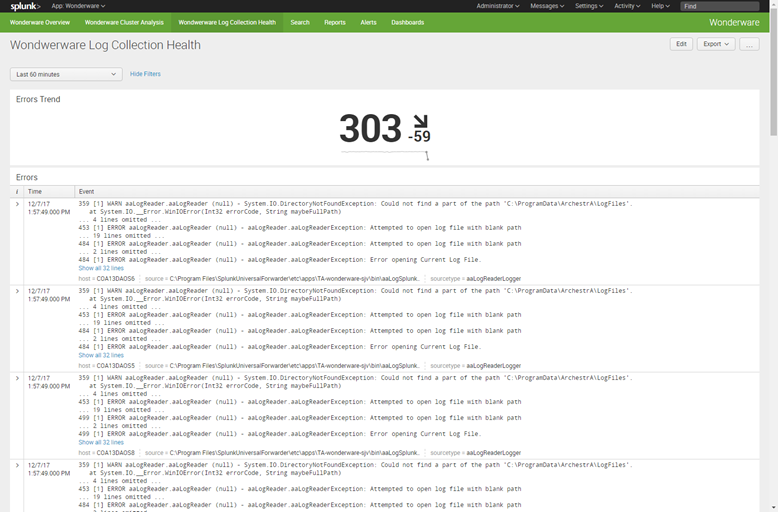
Finally, there is a Log Collection Health dashboard that displays issues with the aaLogReader process (mainly .NET exceptions).
Conclusion
This was a really great opportunity to showcase how powerful and easy-to-use Splunk could be – plus it let me do a little C# (something I did a lot of in the past and kinda miss). The customer was quite impressed as they now had an additional use-case for Splunk that required only a modest level of effort.