
In this post I will be going over how to import unstructured data in to Splunk, extract fields from the data, and use those fields to create a simple dashboard. This example can be followed using a free trial of Splunk, available here. The sample data I will be using is available here. For this post I’ve used a Windows instance of Splunk, but the interfaces are largely the same, so you should have no trouble following along if you choose to use Linux instead.
Table of Contents
Importing the raw data
First we’ll get the actual data in to Splunk so that we can begin working with it. In this case we’ll import the data directly to the Splunk server, but in the real world you’d likely be using Splunk’s Universal Forwarder or sending syslog traps to get the data from another server. Additional information on the Universal Forwarder can be found here.
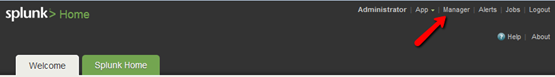
Log in to the Splunk web interface and click on the “Manager” link at the top right of the main page.
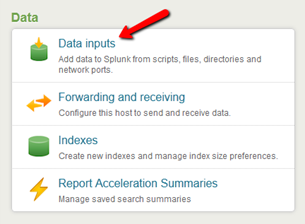
Select “Data inputs” from the “Data” section on the right hand side of the page.
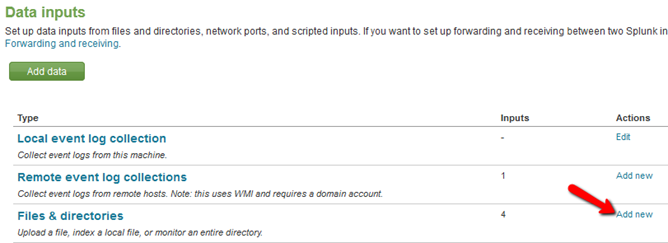
Select the “Add new” action in the row “Files & Directories” (Note: If you are using Linux you will see a slightly different view.)
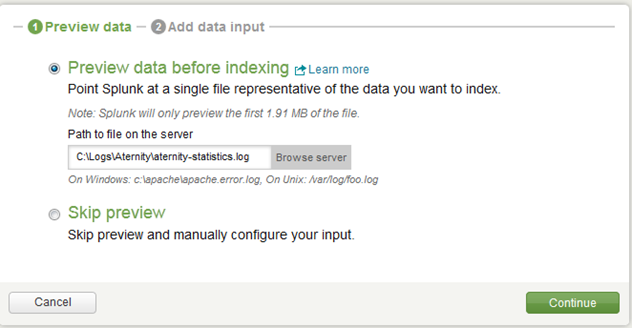
Browse to where you saved the sample file, and then click “Continue”
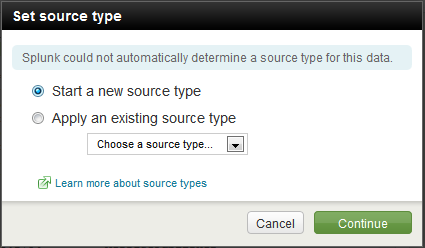
Splunk will then pop up a window saying it could not determine a source type. Since this is our first time bringing Aternity data in to Splunk we will tell it to “Start a new source type” and click “Continue”.
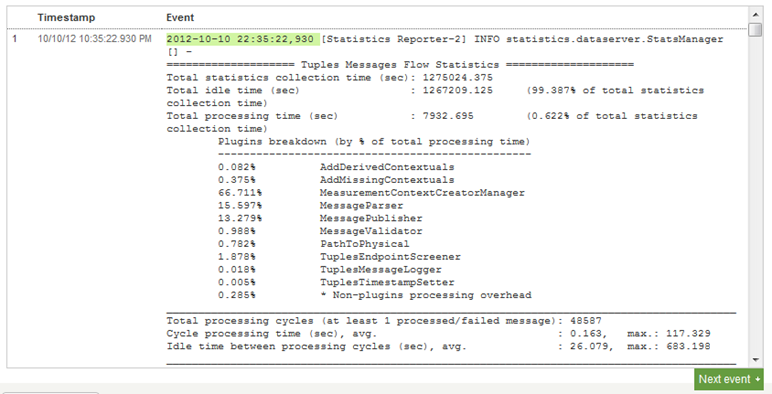
A quick peek at the event viewer shows that Splunk is handling highly verbose multi line log entries like a champ. If the data was being improperly broken up (either multiple messages being treated as a single entry or one message being broken in to multiple parts) you would need to adjust the timestamp and event break settings, which is outside the scope of this post. More information on that can be found here. Given that we’re happy with the way the data looks, click “Continue” to move on to the next step.
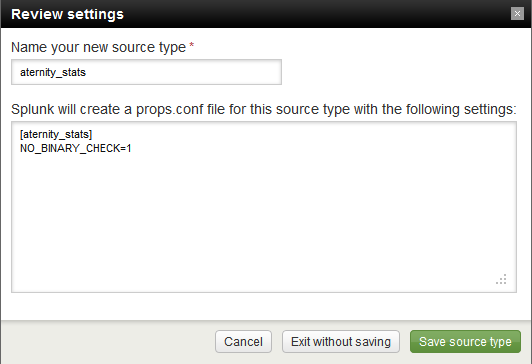
Splunk will pop up another window asking us to name our source type. Because there are multiple potential log file types we might want to bring in to Splunk from Aternity, I will use the name “aternity_stats” so that we can add other “aternity_” source types later and keep things consistent. Click “Save source type” when you’re done reviewing the settings.
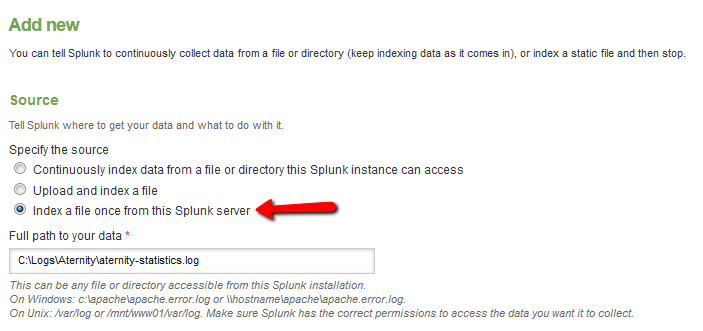
The next page gives us a host of options, but we really only need to concern ourselves with the first one. Splunk will ask us if we want to continually index the data, or if we just want to index the file once. For cases like our where we just want to import a fixed data sample, it’s important to remember to select the Index once option, otherwise Splunk will continue to monitor the file, regardless of whether it’s having any new data added to it. For a demo environment this might not be much of a concern, but in a production environment, things like this can add up and have major performance impacts.
We’ll leave the rest of the settings alone, click “Save” once you’ve had a chance to read over them.
Verify the data
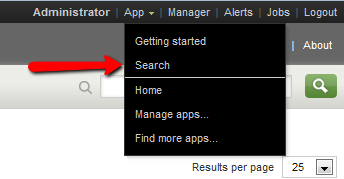
We have now successfully imported the data in to Splunk. We’ll perform a couple of steps to verify this. First, click on “App” in the upper right hand corner and select “Search”.
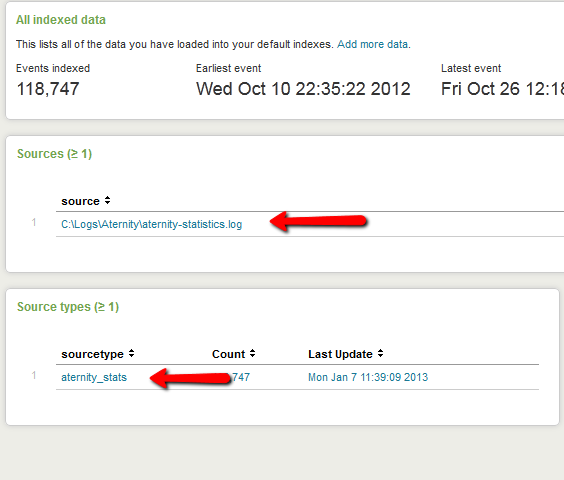
On the main Search app page we’ll see a summary of the data in Splunk. If this is a clean install of Splunk, just seeing a non-zero entry for “Events indexed” is a good indication. We can also see that is has specifically indexed the source we gave it, and that “aternity_stats” is showing up as a sourcetype.
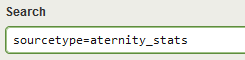
If this were an already running instance, the data volume might not make the Top lists, so we would have to verify it by searching “sourcetype=aternity_stats” and see that results are returning.
Working with field extractions
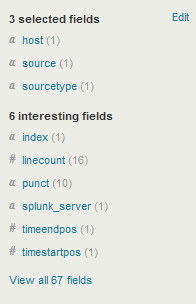
If you haven’t already, run the search above. We’ll see that Splunk automatically identifies any fields that match its key/value pair intelligence, which can be found to the left of the search results. This can often allow you to start putting together useful data visualizations right out of the box.
We’re going to extract data that Splunk doesn’t recognize right away. There are a few of ways to do this, including using Splunk’s Interactive Field Extractor (IFX), or you can write your own regex (which I prefer). If you are unfamiliar with regex a good set of tutorials can be found here. If you are uncomfortable working with regex, I would suggest trying out the IFX, or you can just skip to the next section and work with the pre-built regex that I provide.
Add “Connected EPMs” to your search string so that it reads “sourcetype=aternity_stats Connected EPMs“. It is possible to just display the log in its entirety in the results by clicking “Show all 15 lines” and copy from there, but given that Splunk allows you to navigate the data by clicking, this can make copying a bit trickier.
Instead, click the down arrow next to one of the results and select show source.
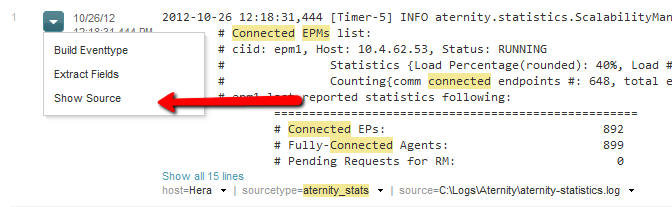
This will display the full source in the context of the log file it was taken from. From there we want to copy all the data that is highlighted. 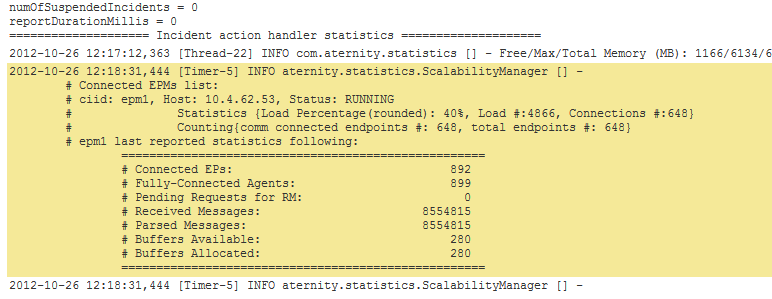
Next you’ll want to fire up the regex tester of your choice. I am personally a fan of RegexBuddy, but there are also free web based tools such as rubular or regexpal (regexpal doesn’t understand the splunk ?<field> syntax, so you will need to add it after the fact). Our goal is to extract the following fields:
- Load Percentage
- Connected EPs
- Fully-Connected Agents
The syntax of (?<field_name>value) is used to tell Splunk what to extract and what to name it, replacing field_name with the name you’d like splunk to use for the field. (see next section examples)
The key is to write the expression you feel most closely matches the data and make sure to test, test, test. In our case, we need to pay particularly close attention to how numbers get formatted in the data: Are they comma separated? Do they have a decimal point? Etc. If you want to take a crack at the regex, stop now and try it out.
Testing regex in Splunk
The following are the regex to extract each of the fields:
Load Percentage\(rounded\): (?<load_perc>\d+)%Connected EPs:\s+(?<connected_eps>[\d,]+)Fully-Connected Agents:\s+(?<connected_agents>[\d,]+)
We can test these in Splunk by piping them via the rex command in to our existing search, for example:
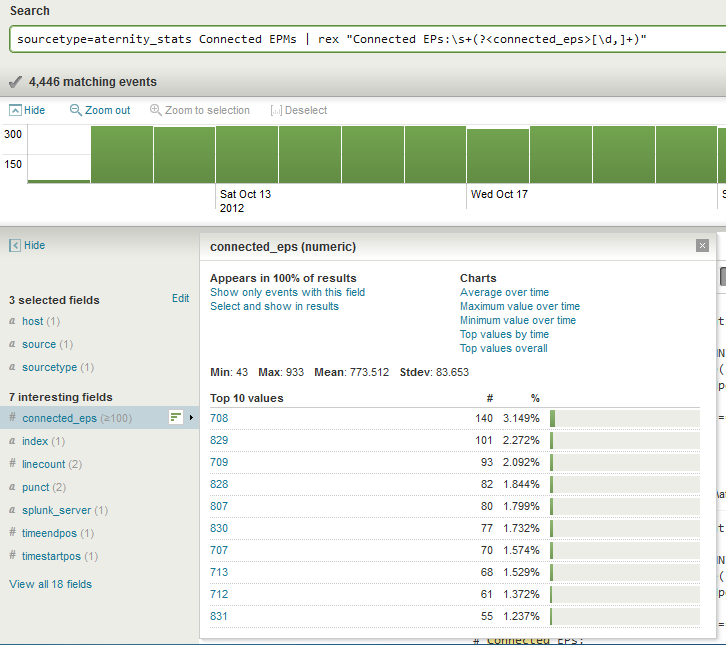
sourcetype=aternity_stats Connected EPMs | rex "Connected EPs:\s+(?<connected_eps>[\d,]+)"
The above search allows us to see the connected_eps field to verify that the data was being extracted properly. As you can see in the screen shot below, the max value never goes above 933. Since it never breaks in to the thousands, we don’t know if it will be comma separated or not, which is why I’ve included a comma as a valid character just in case.
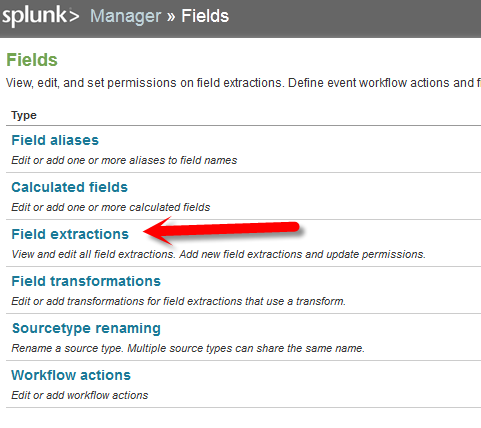
Once we’re satisfied that our regex is extracting what we’ve intended we can set these up as permanent field extractions. Click on the “Manager” link on the top right of the page and Select “Fields” from the “Knowledge” section.
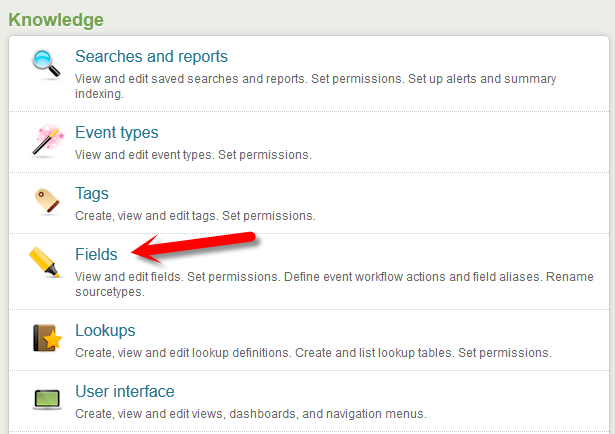
Then select “Field Extractions”
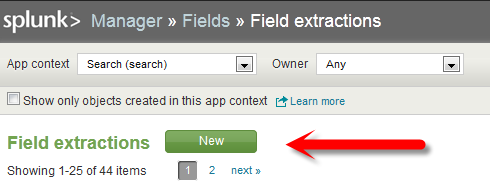
And click on “New” in the next page
We are then presented with the form below, which we want to fill out as pictured:
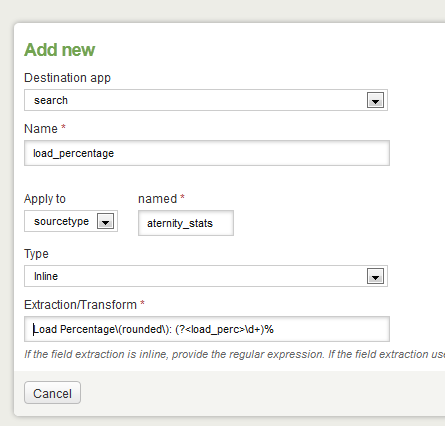
Note that the “Name” field is simply a name for our field extraction, and is separate from the name of the field we’re extracting. In this case, Splunk will extract the variable as “load_perc“, which we’ll see in a minute. In most cases it’s easiest to keep the names identical for simplicity, I’ve just tweaked it in this case to illustrate the point. Click the “Save” button in the lower right when finished. You will be returned to the main Field extractions page. Click “New” and repeat for the other two extracts with the following details:
Name: connected_eps
Sourcetype: aternity_stats
Extraction: Connected EPs:\s+(?<connected_eps>[\d,]+)
Name: connected_agents
Sourcetype: aternity_stats
Extraction: Fully-Connected Agents:\s+(?<connected_agents>[\d,]+)
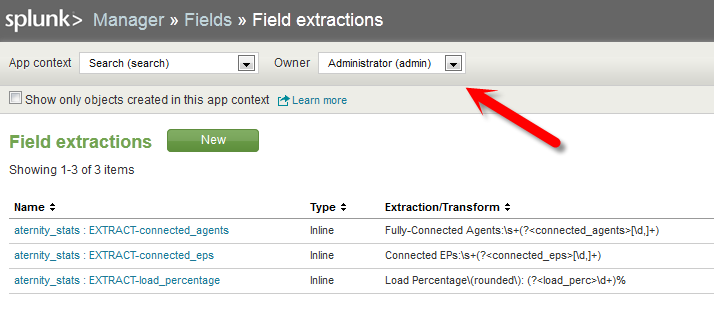
Once this is done we can spot check our work by selecting “Admin” (or whatever user name you’re using) from the “Owner” drop down.
Next click on “<< Back to Search” in the upper left hand corner. Type “sourcetype=aternity_stats” in the main search bar, and click on “View all 70 fields” in the Fields pane to the left of the results.
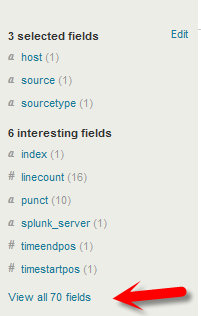
This will present us with a list of all fields related to the search data that is known to Splunk. You can lookup the fields we have entered by typing them in to the “Keyword” box or by just finding them on the list. Click the Green arrow button to the left of the name to add each to the Selected Fields.
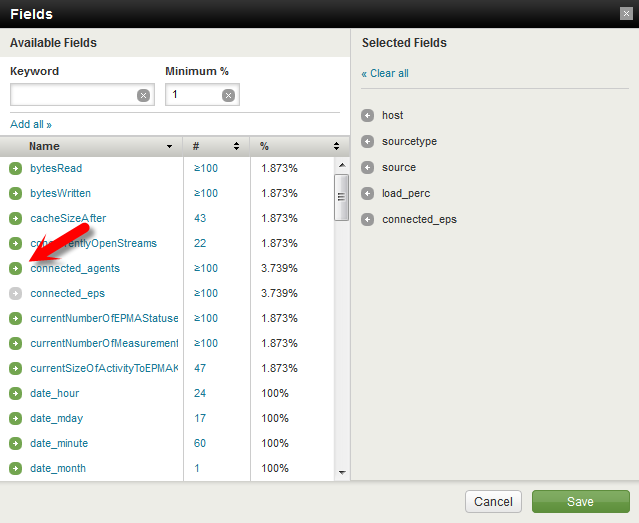
Click “Save” once you’re done. You should now see the selected fields show up in the selected fields pane. You can now quickly access these fields to visualize your data in new ways.
This concludes Part 1 of 2. In this example we’ve imported new unstructured data in to Splunk, and then extracted fields from that data using RegEx, and made sure we didn’t screw up along the way. In the next post we will cover how to use these fields to create dashboards, perform field lookups, and wrap all of this up in to a neat application that you can use to distribute as you see fit.
Check out our YouTube channel for additional videos on Splunk here.
If you’re local to the Seattle area and would like to try this in a guided session, be sure to check out our events page here.